|
Getting your Trinity Audio player ready...
|

If you’re deep in post-exertional malaise, I need you to know this: recovery is real. I’ve recovered from rolling PEM, and while it wasn’t linear or perfect, it changed everything. In this post, I’ll walk you through what life looks like after surviving the crash cycles that defined my existence for months.
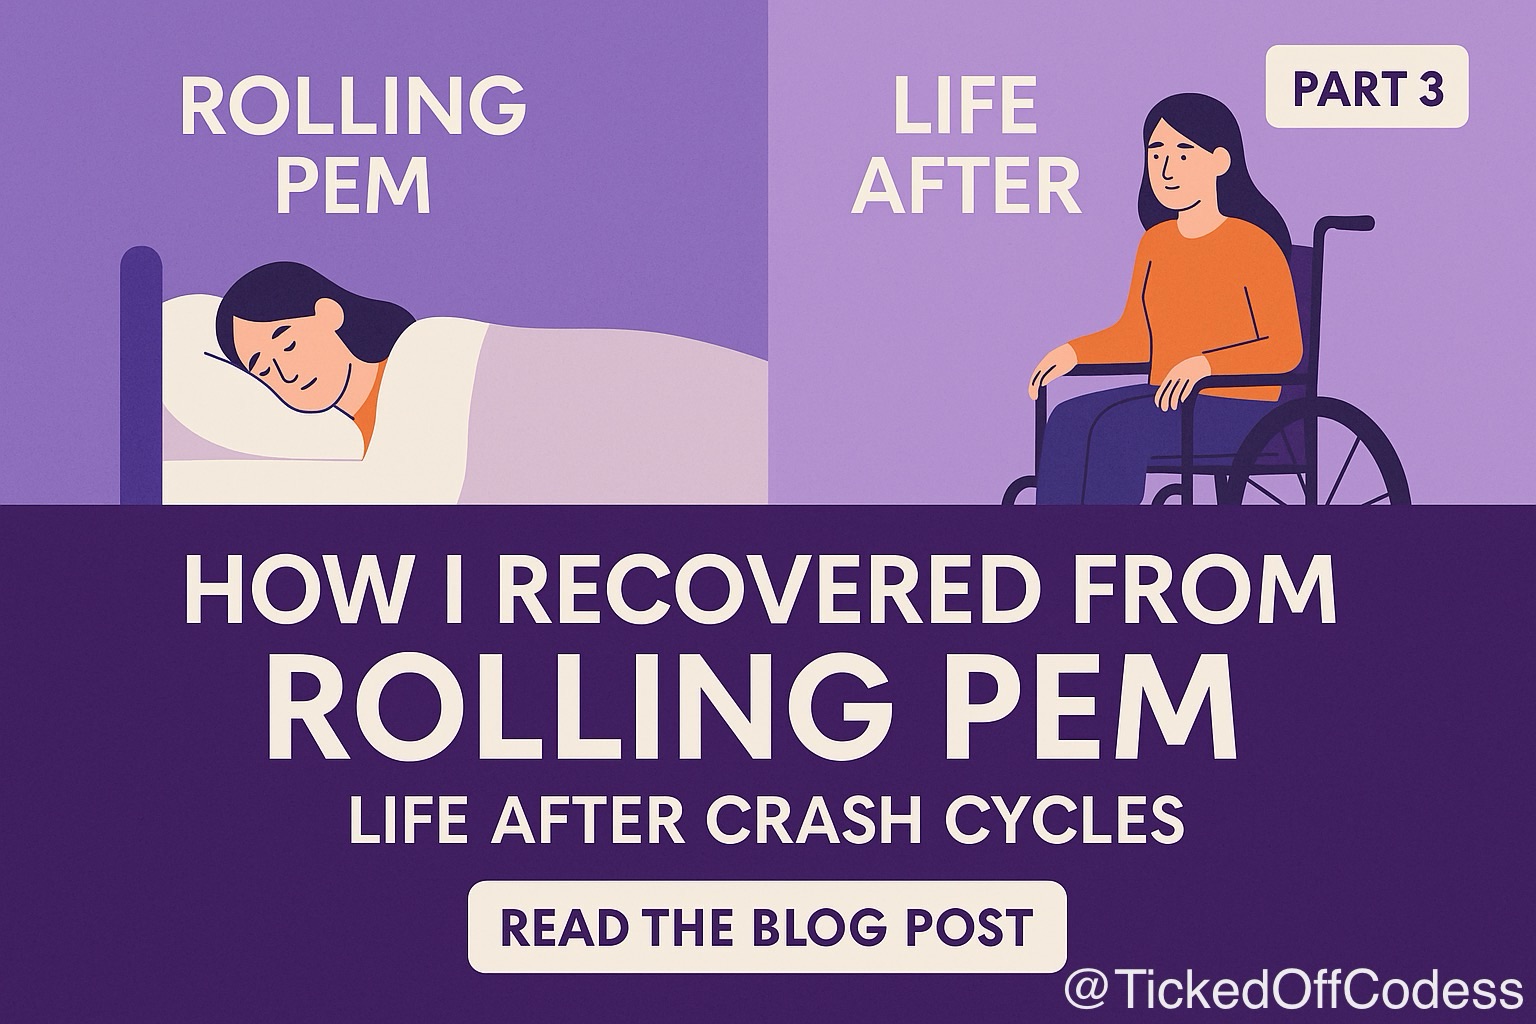
Life Beyond Rolling PEM: How Recovery Felt Day by Day
For a long time, my world revolved around surviving the next crash. Each day brought its own landmine. I couldn’t plan, couldn’t hope, couldn’t even exhale — because rolling PEM was always looming. But once that cycle loosened its grip, something surprising happened: I started to come back to life.
In Part 1, I shared how I spiraled into rolling PEM. In Part 2, I walked through the pacing, heart rate monitoring, and recovery tools that helped me crawl out. Now — Part 3 — the part I wish someone had written for me when I was at my worst: what life actually looks like on the other side. The healing. The unexpected joys. The fear of relapse. The hard-won stability that slowly (and I mean slowly) returned.
Reclaiming Basic Function After Rolling PEM
It started small. But after what I’d been through with severe ME/CFS symptoms, these small things felt monumental.
One of the first breakthroughs was tolerating my caregiver being in the room without it triggering post-exertional crashes. I could lie in bed and have her gently brush my hair — something I once had to postpone for days because it would set off a PEM flare. I could manage a bed bath without needing to recover for a week.
One of the clearest signs that something was changing came in September — the month rolling PEM finally ended. For the first time in three months, I had even a single stable day.

These weren’t glamorous milestones. They weren’t social media-worthy. But they were everything. They were proof that my nervous system wasn’t stuck in emergency mode anymore. That maybe — just maybe — I was stabilizing.
💚 A Note for Caregivers
If you’re caring for someone in rolling PEM recovery, I want to be honest with you: the progress is going to be almost invisible some days. The person you love might not feel better even when their numbers are starting to shift.
That’s where tracking helps — symptom scores, heart rate data, even just a simple notes app. It gives both of you something concrete to point to when everything still feels terrible.
And the small stuff? It’s not small. When I could finally tolerate my caregiver being in the room — just being there — that was a turning point I didn’t even recognize until later. A bed bath without a crash. A brief conversation. These things are recovery happening in real time, even if they don’t look like it.
You’re part of this, even when it doesn’t feel like it. Especially when it doesn’t feel like it.
I didn’t realize how much I’d lost until I got some of it back.
My Rolling PEM Recovery Timeline: What Stabilization Actually Looked Like
Recovery from rolling PEM didn’t happen on a single day. It was a gradual unwinding that I could only see clearly in retrospect. Here’s a rough timeline of how things shifted for me:
February–August 2021: This was the abyss. Every single day was a crash day — I’m not exaggerating. Zero stable days for months. Heart rate spikes, brain fog so thick I couldn’t follow a sentence, pain flares, GI distress. All of it, stacking. I honestly don’t know how my body kept going.
Mid-September 2021: Something shifted. I didn’t trust it at first — I’d been burned by “good hours” before that turned out to be nothing. But rolling PEM ended, and I moved into what I’d call boom-and-bust. Still PEM, still crashing, but with actual space between the crashes. I had my first stable day in months and I remember lying there thinking, is this real?
October–November 2021: This is where it gets hard to describe, because the changes were so gradual. Some days my fatigue scores were better. Some days the brain fog lifted enough that I could hold a thought for more than a few seconds. My heart rate started spending more time in rest zones. But it wasn’t a straight line — I’d have a decent few days and then get slammed again. The difference was that the slams were shorter.
December 2021: Still more bad days than good. But the bad days had changed. They weren’t the “I can’t survive this” kind anymore. I started having short conversations that didn’t cost me a full day of recovery. I watched TV episodes — plural, some weeks. I had gentle routines. Tiny ones. But routines imply a future, and for a long time I didn’t have one of those.
I want to be careful here: this is my timeline. ME/CFS hits everyone differently and I don’t want anyone reading this and panicking because their September doesn’t look like mine. What I can say is that the trajectory can shift. Even when it feels permanently stuck.
Regaining Energy and Joy After Breaking the Rolling PEM Crash Cycle
After months of fearing every movement, I started noticing moments where I didn’t feel trapped by ME/CFS or Long COVID fatigue and PEM.
I remember the first time I laid down to shower for 20 minutes and didn’t crash. The water felt different — not metaphorically, but viscerally. My body no longer interpreted it as a threat.
I began listening to meditations again. Not to manage symptoms — just because I liked them. One night, my partner and I watched a short TV episode together. And afterward, I didn’t crash. That had become so rare, it felt like a miracle.
These moments weren’t dramatic. But they were undeniable signs that my body was no longer caught in a constant crash cycle.
Around this time, my fatigue scores started shifting — not dramatically, but consistently. I wasn’t crashing from small efforts anymore. Here’s what that looked like:

Another quiet but meaningful change was in my cognitive clarity. Brain fog didn’t vanish — but it stopped dominating every day.

These shifts weren’t just emotional — they were physiological. My heart rate data told the same story: my body was spending more time in rest and recovery heart rate zones, and less in survival mode.

In Q3, I was stuck in yellow, orange, and red zones — signs of overexertion in ME/CFS. But by Q4, I was spending far more time in blue and green zones. It didn’t mean I was “cured.” But it meant my system was no longer spiraling from every effort.
Finding My Identity and Purpose Post-Rolling PEM
Rolling PEM had stripped away so much of who I thought I was. My routines, my productivity, my confidence. But slowly, I began piecing myself back together.
Once survival wasn’t my full-time job, I started wondering who I was beyond the illness.
ME/CFS pacing and crash recovery gave me just enough bandwidth to rediscover small joys. Writing this blog became part of that — not just documenting post-exertional malaise recovery, but reconnecting with my own voice.
Pain no longer overwhelmed me daily. The highs weren’t as high. My baseline was shifting.

GI symptoms also began to calm — a shift I attribute partly to my MCAS protocol and autonomic nervous system stabilization.

Writing this blog became part of that healing. Tracking my symptoms, charting trends — it wasn’t just data. It was storytelling. It reminded me that I still had a voice, even when my body felt quiet.
I started laughing again. Not in the polite way you do when you’re masking pain, but real, spontaneous laughter — the kind that catches you off guard. I started talking with my partner about something other than symptoms. We made plans. Small ones. Safe ones. But still — plans.
Joy didn’t flood back in. It crept in. But it stayed.
Coping with the Fear of Relapse After Rolling PEM Recovery
I wish I could say I felt fearless once things improved. But that wouldn’t be honest.
It wasn’t just the healing that caught me off guard — it was the fear of losing it.
My heart rate patterns backed up what I was feeling — my nervous system was finally calming down. But even that stability made me anxious.

HRV data became another anchor for understanding my healing. Each time I stabilized, it was reflected in the numbers. Here’s how HRV changed alongside my recovery:

And my lowest sleeping heart rate dropped as my HyperPOTS was manageable and my body learned how to rest again.

The better I felt, the more afraid I became of losing it all again. I was scared of doing too much. Scared of getting hopeful. Scared of breaking the delicate rhythm my body had started to trust.
That fear makes sense. It’s part of healing. Recovery isn’t linear — and it isn’t guaranteed. But it is possible.
What helps me stay grounded:
- Pacing, even on good days — the temptation to “make up for lost time” is real and I fall for it more than I’d like to admit, but consistency protects my baseline.
- Heart rate monitoring, because my brain will tell me I’m fine when my body is screaming. The numbers don’t lie.
- Journaling, so I can look back and see patterns my anxious brain conveniently forgets.
- Body trust, which sounds woo-woo but really just means honoring my limits day after day until it becomes automatic. It’s not there yet.
- Community, because knowing other people have survived this road makes the fear feel less like a life sentence.
The fear is still there sometimes. But it doesn’t run the show anymore.
Recovered from Rolling PEM: My New Quality of Life
Recovering from rolling PEM was the hardest thing I’ve ever done. It took discipline, patience, and support. But it was possible — and for me, that possibility became reality.
Even now, I still have more bad days than good. But the bad days don’t crush me the same way. And the good days — they matter. I’m living again.
It took time. It took setbacks. But I’m here now — and that means you can get here too.
Even if progress feels microscopic, even if you still have more bad days than good — you are healing. You are learning. And that matters.
If I ever doubt how far I’ve come, I look at this. It’s not just a chart — it’s proof that my body is learning to hold peace.

This is Part 3 of the story. Not the end — just the first chapter of what comes after surviving.
📊 Free Download: PEM Recovery Tracking Template
The charts and data in this post didn’t happen by accident — they came from months of consistent daily tracking. If you’re working your way out of rolling PEM (or already on the other side), having a structured way to log symptoms, heart rate data, and milestones can make a real difference.
I created a free PEM Recovery Tracking Template based on the exact methods I used during my own recovery. It includes:
- Daily Symptom Tracker — fatigue, brain fog, pain, nausea, sleep quality, and heart rate metrics
- Monthly Summary — see your PEM days vs stable days trend over time
- Heart Rate Zone Log — track your shift from overexertion toward rest and recovery
- Recovery Milestones — a place to record every win, no matter how small
When the fear of relapse creeps in, your own data can be your anchor.
Download (Google Sheet) Download (Excel)
This template is for personal tracking only and is not medical advice. Adjust heart rate zones to match your own anaerobic threshold. Share relevant data with your care team.
Frequently Asked Questions About Recovering from Rolling PEM
What does “recovered from rolling PEM” really mean?
For me, it meant no longer experiencing daily compounded PEM crash cycles — the kind where one flare stacked onto the next with no break in between. I had regained some basic function and started seeing consistent physiological improvements. I wasn’t cured, but I had stabilized and reclaimed parts of my life. I had entered a boom-and-bust pattern instead — still experiencing PEM, but with at least a day or two of stability between crashes. That space made all the difference.
How long did it take to recover from rolling PEM?
My recovery began after months of pacing, HR monitoring, and medication adjustments. September 2021 was the turning point, but it took consistent effort starting long before that.
Can someone with ME/CFS or Long Covid really recover from rolling PEM?
Everyone’s path is different — and ME/CFS prognosis varies widely — but I believe meaningful improvement is possible. This blog series is my story of how I recovered from rolling PEM — and it’s a story still unfolding.
Does recovering from rolling PEM mean I’m cured of ME/CFS?
No — and I think this is important to say clearly because the word “recovery” can be misleading. I still have ME/CFS. What ended was the rolling part — that compounding cycle where every crash fed the next one with no break. I moved into boom-and-bust, which is still PEM, still crashes, but with breathing room between them. That breathing room changed my life. But I still pace every day, still watch my heart rate, still respect limits that would seem absurd to a healthy person.
What were the first signs that rolling PEM was ending?
Honestly? I almost missed them. The first real sign was having a single stable day — one day where the crash didn’t compound. At the time I didn’t even trust it. I thought it was a fluke.
Looking back, there were other clues: I could tolerate hair brushing without it wrecking me. A bed bath didn’t require days of recovery. My heart rate started spending more time in rest zones instead of overexertion zones. But here’s the thing — I saw all of that in my tracking data before I felt emotionally sure anything was changing. The data knew before I did.
Can heart rate monitoring help track PEM recovery?
It was one of the most useful tools I had, honestly. Watching my heart rate zone data shift — less time in yellow, orange, and red, more time in blue and green — gave me proof that something was happening when my brain was still convinced nothing had changed. HRV and my lowest sleeping heart rate told the same story over time. I go deeper into the monitoring setup in Part 2 and I’m writing a whole separate series on heart rate monitoring for pacing, so stay tuned for that.
Is it normal to fear relapse after recovering from rolling PEM?
God, yes. I write about this more above, but the short version: the better I felt, the more scared I got. Which sounds backwards, but it makes sense when you think about it — you finally have something to lose again.
What helped me: pacing even on good days (especially on good days), heart rate monitoring so I had something objective when my brain was spiraling, journaling so I could look back at patterns instead of relying on anxious memory, and just… showing up consistently. Doing the boring work of respecting my limits over and over until my body started to trust the process. The fear hasn’t fully gone away. But it’s background noise now, not the main track.
Have you experienced rolling PEM? I’d love to hear how your journey’s unfolding — what worked, what didn’t, and what gave you hope. Drop a comment or share this with someone who might need it.
Recovery from rolling PEM didn’t happen by chance. It was the result of consistent pacing, careful symptom tracking, and tools I leaned on every day. If you’re currently in the thick of rolling PEM, review the PEM Avoidance Toolkit – a free resource with strategies that helped me survive the worst of it.
📖 Rolling PEM Recovery Series:
- Part 1: How I Escaped the Horror of Rolling PEM — How I spiraled into rolling PEM
- Part 2: How I Got Out of Rolling PEM — Pacing, HR monitoring, and recovery tools
- Part 3: Quality of Life After Rolling PEM (you are here)
- Related: Rolling PEM: What It Is and How to Avoid It
Post Disclaimer
The information contained in this post is for general information purposes only.
The Ticked Off Codess is a blog sharing my experiences and opinions as a patient with multiple complex chronic illnesses. It does not intend to provide professional, legal, or medical advice. I share what has helped me, which may not necessarily help others. YMMV. Before trying anything, you should consult with your medical professional.
The information is provided by Ticked Off Codess and while we endeavour to keep the information up to date and correct, we make no representations or warranties of any kind, express or implied, about the completeness, accuracy, reliability, suitability or availability with respect to the website or the information, products, services, or related graphics contained on the post for any purpose.
To Readers: The content of this blog is based on my research, knowledge, and perspective. It may not reflect the views or practices of other patients or organizations. I do not endorse or promote any products, services, or websites I mention or link to in this blog. I am not responsible for the accuracy, completeness, or suitability of the information I provide or that you obtain from this blog or its links. You should always verify the information and use your judgment before applying it to your situation.
To Commenters: The comments section of this blog is open for discussion and feedback. However, I reserve the right to moderate, edit, delete, or block any comments that are abusive, offensive, spammy, or irrelevant. I also reserve the right to ban any users who violate these rules or the terms of service of this platform. The opinions commenters express are theirs and do not necessarily represent my views or opinions.
Pingback: How I Escaped the Horror of Rolling PEM - Ticked Off Codess
Pingback: How I Escaped the Horror of Rolling PEM: Part 1 - Ticked Off Codess
Pingback: How I Got Out of Rolling PEM: Part 2 - Ticked Off Codess